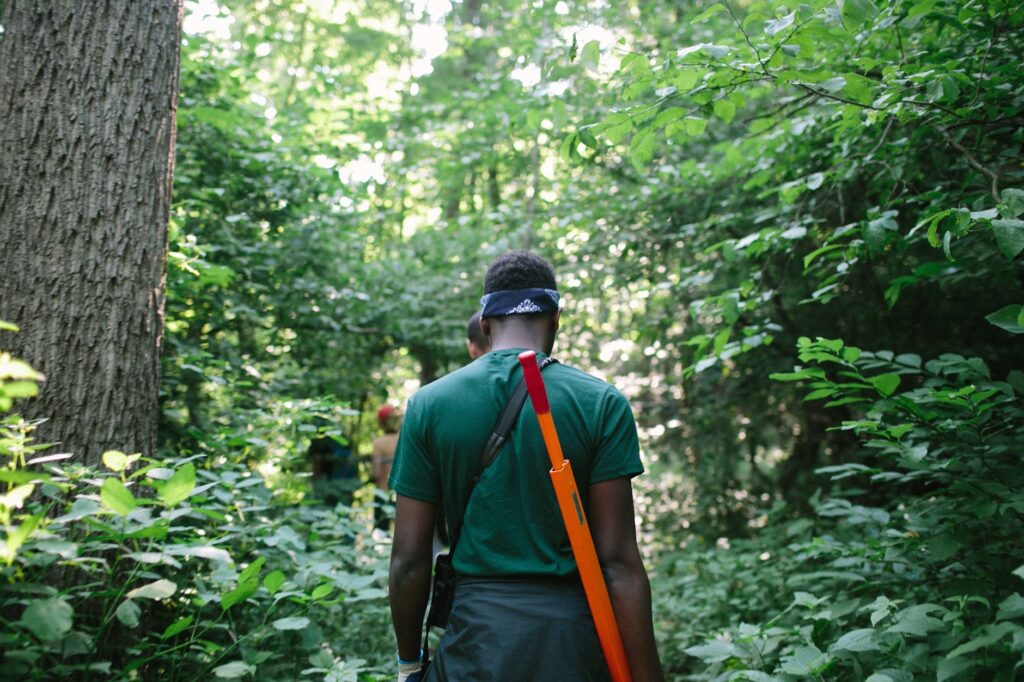
On the broadest level, an ecosystem consists of organisms in a shared place or context and the relationships between them. There are many different types of ecosystems; they can be biological, like a rainforest, or social, like a learning ecosystem. And within the world of learning ecosystems, there are still more subcategories. A literacy ecosystem, for example, is a type of learning ecosystem composed of networked people, organizations, and places that support literacy development across the same area.
No matter the type, ecosystems must work to make their constituent networks visible. This ensures they can continue to grow and benefit their members through resource sharing and connections.

What is ecosystem mapping?
When it comes to building network visibility, the process of “ecosystem mapping” can help. This process identifies how resources are currently distributed across an ecosystem and promotes thinking about how they might be more equitably distributed in the future. Importantly, ecosystem mapping opens up new conversations among partners and helps build stronger relationships and a shared sense of purpose.
As the Community Strand of the 3Rs: Reading, Racial Equity, and Relationships project, my team and I have worked directly on ecosystem mapping. We recently mapped organizations in Allegheny County’s literacy ecosystem that serve learners in grades K-3. The goal of this project, which took a little over a year to complete, was twofold:
- First, to identify the central players that carry a lot of influence in the ecosystem
- Second, to identify gaps where new resources may be needed
As an added benefit, the effort helped us see where our 3Rs Initiative might fit into the ecosystem. (And, spoiler! Our role may be to support organizations’ commitments to racial equity in literacy.)
How to map an ecosystem
There is no instruction manual for mapping a social ecosystem. Our process was inspired by Tom Akiva, Marijke Hecht, and Esohe Osai’s “Creative Learning in Pittsburgh,” as well as the Urban Institute’s “Guide to Civic Tech and Data Ecosystem Mapping.”
We learned as we went and gathered a few key takeaways. We hope you’ll use these tips to map a part of your ecosystem of interest:
Talk to key organizations and explore how they are connected.
Draft some guiding questions that keep you focused on the most useful information. Our guiding questions included: 1) What role(s) does your organization play in the larger ecosystem? 2) What locations do you serve? 3) What other literacy organizations do you work with and what is the nature of that work? 4) What would a “literacy paradise” look like to you?
Other helpful questions might ask about shared histories among organizations, funding streams, or personnel.
Use multiple research methods.
Explore your ecosystem through both quantitative and qualitative measures. Don’t just identify the frequency or strength of relationships between organizations or ideas; give voice to those relationships! Ask participants to expand on, describe, or give meaning to their connections.
To do this, we first performed extensive online searches to learn as much about the organizations’ histories and missions as we could. Then, we used this knowledge to ask our guiding questions through tailored surveys, interviews, and focus groups. This helped us combine qualitative methods with the heavily quantitative process of identifying and quantifying relationships in a social network.
Plus, the more you hear from your stakeholders, the more relationship building you are doing and the more you can center their voices in your work.
Include stakeholders in the process.
Participants in our project offered feedback on preliminary findings through focus groups, which shaped how we interpreted and reported our findings. Depending on interest and availability, including stakeholders in the data analysis process can also be a way to nurture deeper relationships with participants while building their organizational capacity and buy-in.
Iterate.
Ecosystem mapping should be routinely undertaken to keep your model up-to-date. And, it doesn’t have to be perfect! It can be a work in progress. Having community voice and input will add depth to your work even if the maps don’t capture every nuance of these rich ecosystems.
Want to learn more?
Overall, mapping organizations in Allegheny County’s literacy ecosystem was a complex, but extremely valuable, process.
To learn more about what we did, check out the community report on our mapping project, Mapping Organizations in Allegheny County’s Literacy Ecosystem, as well as these additional resources:
- What is a Learning Ecosystem? (blog series)
- What are Ecosystem Maps? (blog)
- Kumu (free network mapping platform with examples of mapping projects)
- Western PA Regional Data Center (local data at your fingertips!)


Mapping Organizations in Allegheny County’s Literacy Ecosystem is part of the 3Rs: Reading, Racial Equity, and Relationships project co-led by Moye & Wanless (the early school-age cohort of The Pittsburgh Study; co-led by Miller & Friedman) housed at the University of Pittsburgh’s Office of Child Development. The 3Rs goal is to support children thriving in reading, particularly for Black students, across Allegheny County. Our ecosystem approach targets all the spaces children learn to read: homes, classrooms, schools, and communities. Funding for this study came from the University of Pittsburgh School of Education Student/Faculty Research Grant and the Children’s Hospital Foundation. For more information about the 3Rs Initiative, contact tps.3Rs@pitt.edu.
